
Potential 60% Surge in Bitcoin Price Hinges on Confirmation of ‘Textbook’ Chart Pattern, Says Trader

Bitcoin price has the potential to surge by a substantial 60% if a distinctive chart pattern materializes, according to a trader. The cryptocurrency is currently forming an inverse head-and-shoulders pattern, which, if confirmed, could ignite a rapid upward movement towards $40,000. This significant price rally is contingent upon the preservation of a long-term chart feature.
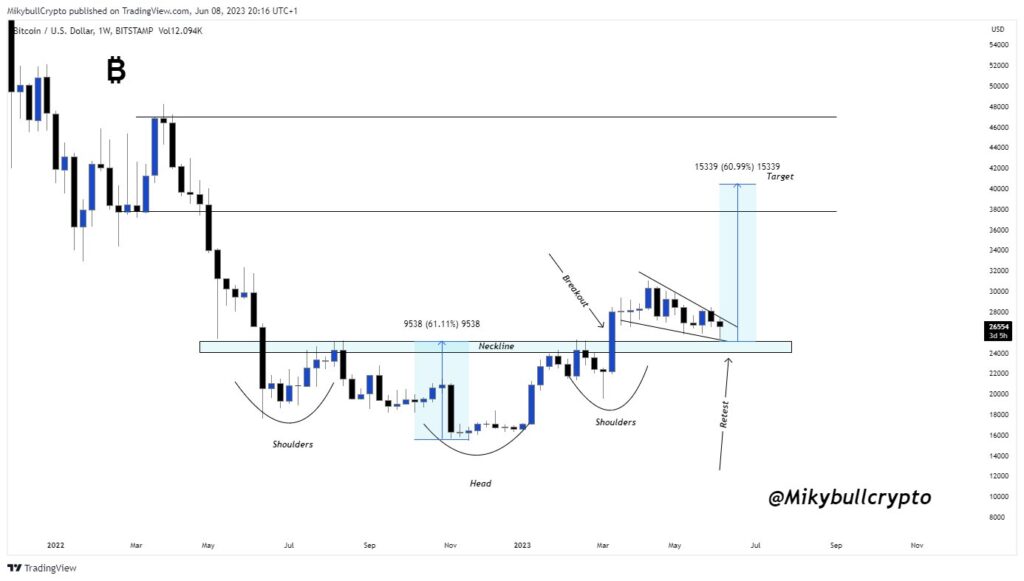
In his recent analysis on June 8, renowned trader Mikybull Crypto highlighted positive indications on the BTC/USD weekly chart. As Bitcoin has remained locked within a narrow trading range for nearly three months, short-term price targets have been elusive for market participants. Daily performance has failed to establish a definitive trend, with the $30,000 level posing as a formidable resistance.
Trader Jelle advised caution and advocated placing bids at the extremes, suggesting that the market has remained stagnant. The prevailing sentiment emphasizes the importance of focusing on the direction indicated by higher timeframes.
Contrary to the prevailing market perspective, Mikybull Crypto identified compelling price action on the horizon based on the higher timeframes. The weekly chart exhibits the completion and subsequent retesting of an inverse head-and-shoulders pattern for BTC/USD. This bullish pattern contrasts with the conventional head-and-shoulders pattern, typically associated with resistance consolidation and subsequent downward movement.
While a bearish head-and-shoulders pattern emerged on the daily timeframes around the local highs of $31,000 in April, the broader trend might still favor the bulls. Mikybull Crypto elaborated, stating that Bitcoin is currently displaying a textbook inverse head-and-shoulders pattern on the weekly timeframe. The price is presently retesting the neckline after the breakout.
Notably, the $40,000 level and its vicinity have already attracted significant attention among traders. Market analyst Crypto Kaleo has consistently referred to $40,000 as a magnet for the market. Moreover, Bitcoin has managed to maintain crucial support trend lines throughout the three-month range.
Another trader and analyst, Credible Crypto, shared a prediction this week, asserting that $40,000 would not serve as the upper limit for Bitcoin in 2023. He anticipated a sideways movement for BTC between $20,000 and $40,000 for approximately 12 months until the Bitcoin halving in April 2024. Following the halving, he anticipated the commencement of the next bull run, propelling Bitcoin to surpass $100,000 by 2025. However, Credible Crypto acknowledged that reality might differ from these expectations, as Bitcoin could achieve new all-time highs in 2023, leaving many investors on the sidelines.
In conclusion, the formation and confirmation of an inverse head-and-shoulders pattern could propel Bitcoin’s price by 60%, reaching the $40,000 level. Traders are closely monitoring the weekly chart and the preservation of key support trend lines. While $40,000 has already garnered considerable attention, predictions vary regarding Bitcoin’s performance in 2023, with some anticipating a new all-time high.